The thinking
behind the numbers.
Exploring questions through data, building useful tools, and making the results understandable.
Explore the work01 / Portfolio
Selected work
Example projects · ready for your work
Inside the project / 01
A clearer view of performance
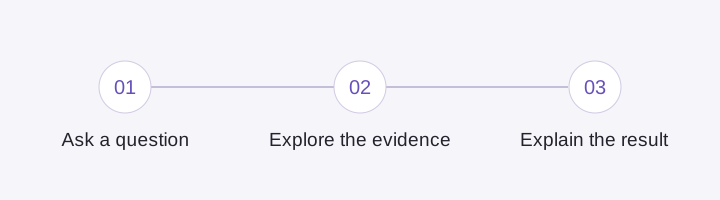
The question
The approach
The result
Your Power BI report belongs here.
This example is ready for a report embed. Once connected, visitors can explore its pages, filters, and visuals.
Example · report not connectedA report can be public or require Microsoft sign-in, depending on its sharing settings.
Inside the project / 02
Show your working.
Code, context, and the output — together in one readable notebook.
Illustrative notebook using synthetic records. Runs locally in Jupyter; this page displays its saved output.
Open full notebook02 / Approach
More than
the final chart.
This is a space for the work, decisions, and details behind my projects. Each case study brings the outcome together with the analysis that supports it.
03 / Contact
Start a conversation.
Contact details will appear here when added.