Stop 02 / 06  ·  Selected work

LSE student outcomes.

B3 Threshold Dashboard · Higher education

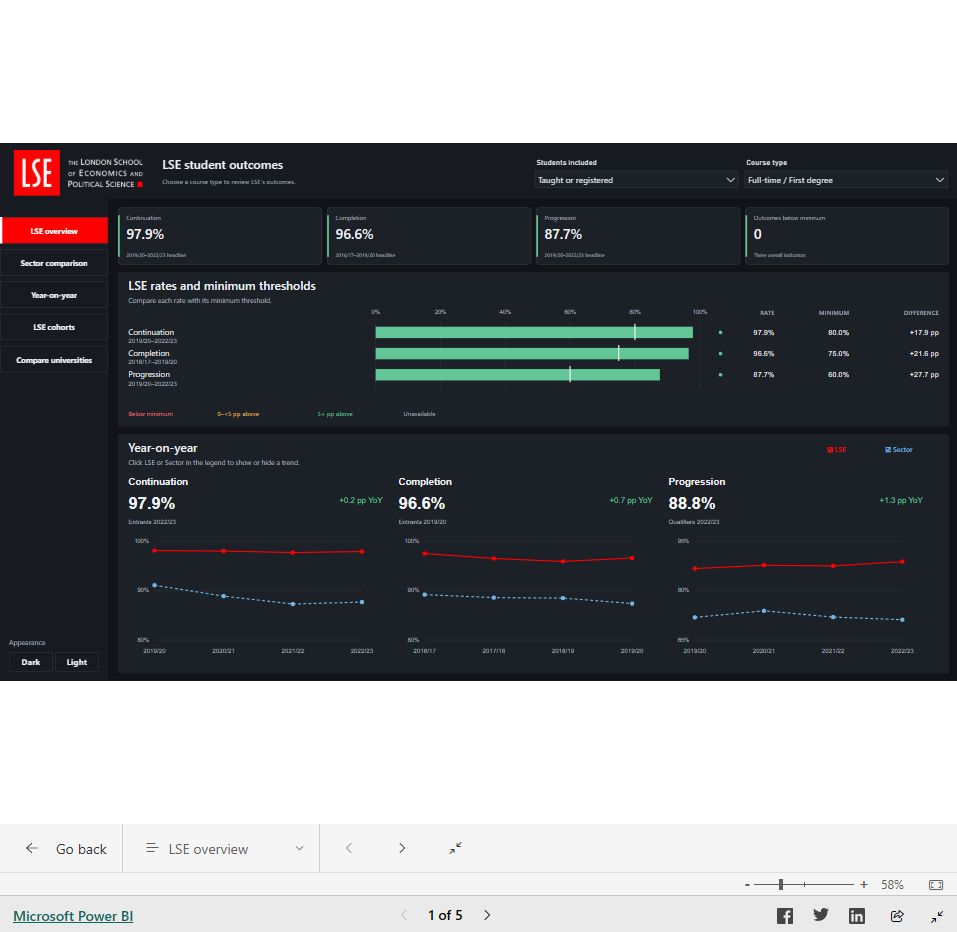
The LSE dashboard compares student continuation, completion and progression with Office for Students B3 thresholds.

Five pages cover cohorts, annual trends and university comparisons, with adjustable thresholds and confidence intervals.

For taught or registered, full-time first-degree students, the headline progression rate was 87.7%, against a displayed minimum of 60%. The dashboard lets you check other groups for yourself.

The university quarter at dusk, with a stepped path.
02 / University quarter
INTERACTIVE REPORT

London School of Economics B3 Threshold Dashboard

TECH STACK
  • Power BI
  • DAX
  • Power Query
  • Alteryx
Open report
Saved overview of London School of Economics B3 Threshold Dashboard

Choose a study mode and course level to compare LSE’s published Office for Students indicators with the sector. Each outcome follows a different set of cohorts.

For taught or registered, full-time first-degree students, continuation was 97.9%, completion was 96.6% and progression was 87.7%. The corresponding minimums shown on the overview are 80%, 75% and 60%.

Try adjusting a threshold to see how much headroom a cohort has. The confidence intervals show the uncertainty around each estimate. This independent portfolio analysis uses the thresholds as reference points.

Explore the data model ↓
Data source & licence

Student outcomes data from the Office for Students. Contains public sector information licensed under the Open Government Licence v3.0 where owned by OfS. Third-party rights are listed in the OfS copyright notice.

Data model

One published outcome observation links to its provider, student population, outcome, study group, reporting period, split and source release.

Relationships
100%
FactFactOutcomeObservation54 columns

Columns

  • ObservationKey
  • ProviderKeyDimProvider.ProviderKey
  • PopulationViewKeyDimPopulationView.PopulationViewKey
  • OutcomeMeasureKeyDimOutcomeMeasure.OutcomeMeasureKey
  • StudyKeyDimStudy.StudyKey
  • ReportingPeriodKeyDimReportingPeriod.ReportingPeriodKey
  • ReportingSplitKeyDimReportingSplit.ReportingSplitKey
  • SourceReleaseKeyDimSourceRelease.SourceReleaseKey
  • OutcomePct
  • ThresholdPct
  • Denominator
  • BenchmarkPct
  • PublishedDifferencePpt
  • ResponseRatePct
  • BelowThresholdUncertaintyPct
  • AboveThresholdUncertaintyPct
  • BelowBenchmarkUncertaintyPct
  • AboveBenchmarkUncertaintyPct
  • StandardDeviation
  • ContributionToBenchmarkPct
  • OutcomeLower75Pct
  • OutcomeUpper75Pct
  • OutcomeLower77Pct
  • OutcomeUpper77Pct
  • OutcomeLower80Pct
  • OutcomeUpper80Pct
  • OutcomeLower82Pct
  • OutcomeUpper82Pct
  • OutcomeLower85Pct
  • OutcomeUpper85Pct
  • OutcomeLower87Pct
  • OutcomeUpper87Pct
  • OutcomeLower90Pct
  • OutcomeUpper90Pct
  • OutcomeLower92Pct
  • OutcomeUpper92Pct
  • OutcomeLower95Pct
  • OutcomeUpper95Pct
  • OutcomeLower97Pct
  • OutcomeUpper97Pct
  • OutcomeLower99Pct
  • OutcomeUpper99Pct
  • OutcomePctRaw
  • DenominatorRaw
  • BenchmarkPctRaw
  • PublishedDifferencePptRaw
  • SuppressionReason
  • BenchmarkSuppressionReason
  • IsHeadline
  • HasComparableOutcome
  • BelowOfficialThresholdFlag
  • ScopeYear
  • ScopeRange
  • IsCurrentHeadline
DimensionDimProvider18 columns

Columns

  • ProviderKeyFactOutcomeObservation.ProviderKey
  • ProviderUKPRN
  • ProviderName
  • ProviderShortName
  • ProviderRegion
  • CountryCode
  • ProviderCategory
  • FEProvider
  • ProviderType
  • Specialist
  • RussellGroup
  • UniversityAlliance
  • MillionPlus
  • GuildHE
  • Pre92
  • Post92
  • IsSectorAggregate
  • MetadataSource
Measure hostB3 Measures1 column · 143 measures

Columns

  • Anchor

Measures

Annual trends
  • Annual Outcome Pct
  • Annual Sector Pct
  • Annual YoY Pp
  • Previous Annual Outcome Pct
Appearance
  • Annual Appearance
  • AppearanceMode
  • Button Dark Fill
  • Button Light Fill
  • Chart Appearance
  • Comparison Annual Appearance
  • LSE Headline Appearance
  • Peer Headline Appearance
  • Provider Headline Appearance
  • Sector Headline Appearance
  • Theme Accent
  • Theme Bad
  • Theme BadBg
  • Theme Blue
  • Theme Canvas
  • Theme Card
  • Theme Good
  • Theme GoodBg
  • Theme Grid
  • Theme Highlight
  • Theme Muted
  • Theme Positive
  • Theme Rail
  • Theme Text
  • Theme Warn
  • Theme WarnBg
Comparable observation counts
  • % Above Threshold
  • % Below Threshold
  • Total Indicators
Compatibility
  • Tooltip Row Colour
  • Tooltip Value
Confidence intervals
  • CI Range %
  • CI Width Pp
  • Risk Status
  • Selected Confidence Level
  • Selected Lower CI
  • Selected Lower CI %
  • Selected Upper CI
  • Selected Upper CI %
LSE views
  • Comparison Annual Peer Name
  • Comparison Peer Name
  • Comparison University Name
  • Completion Headline Gap Pp
  • Completion Headline Pct
  • Completion Headline Period
  • Confidence Label
  • Continuation Headline Gap Pp
  • Continuation Headline Pct
  • Continuation Headline Period
  • LSE Below Minimum Outcomes
  • Observation Period
  • Overall Headline Pct
  • Progression Headline Gap Pp
  • Progression Headline Pct
  • Progression Headline Period
  • Selected Cohort View
  • Show Uncertainty
Published observations
  • Cell Colour
  • Completion Value
  • Continuation Value
  • Current Threshold
  • Distance to Band
  • Distance to Threshold
  • Headline Value %
  • INDICATOR_VALUE %
  • Outcome Rate Pct
  • Progression Value
  • Published Benchmark Difference Pp
  • Published Benchmark Pct
  • Published Denominator
Quality checks
  • Context Status
  • Count Reconciliation Difference
  • Observation Count
  • Observation Note
  • Providers With Data
  • Single Observation
Scenario only
  • Scenario Threshold Pct
  • Threshold Adjustment Value
Scoped annual values
  • LSE Annual Denominator
  • LSE Annual Rate Pct
  • LSE Annual Rows
  • LSE Annual Threshold Pct
  • LSE Annual YoY Pp
  • LSE Previous Annual Pct
  • Peer Annual Denominator
  • Peer Annual Rate Pct
  • Peer Annual Rows
  • Peer Annual Threshold Pct
  • Peer Annual YoY Pp
  • Peer Previous Annual Pct
  • Provider Annual Denominator
  • Provider Annual Rate Pct
  • Provider Annual Rows
  • Provider Annual Threshold Pct
  • Provider Annual YoY Pp
  • Provider Previous Annual Pct
  • Sector Annual Denominator
  • Sector Annual Rate Pct
  • Sector Annual Rows
  • Sector Annual Threshold Pct
  • Sector Annual YoY Pp
  • Sector Previous Annual Pct
Scoped headline values
  • LSE Headline Denominator
  • LSE Headline Lower CI
  • LSE Headline Period
  • LSE Headline Rate Pct
  • LSE Headline Rows
  • LSE Headline Threshold Pct
  • LSE Headline Upper CI
  • LSE Overall Denominator
  • LSE Overall Period
  • LSE Overall Rate Pct
  • LSE Overall Threshold Pct
  • Peer Headline Denominator
  • Peer Headline Lower CI
  • Peer Headline Period
  • Peer Headline Rate Pct
  • Peer Headline Rows
  • Peer Headline Threshold Pct
  • Peer Headline Upper CI
  • Provider Headline Denominator
  • Provider Headline Lower CI
  • Provider Headline Period
  • Provider Headline Rate Pct
  • Provider Headline Rows
  • Provider Headline Threshold Pct
  • Provider Headline Upper CI
  • Sector Headline Denominator
  • Sector Headline Lower CI
  • Sector Headline Period
  • Sector Headline Rate Pct
  • Sector Headline Rows
  • Sector Headline Threshold Pct
  • Sector Headline Upper CI
Scoped sector counts
  • At or Above Threshold Count
  • Below Threshold Count
  • Comparable Providers
  • Missing Outcome Count
Source values
  • Published Single Rate Pct
Drag to pan · Ctrl + wheel to zoom · Expand a table to see its fields · Drag its grip to move it One Many Key Foreign key