
FactFactPurchases5 columns
Columns
- DateDimDate.Date
- CustomerIDDimCustomer.CustomerID
- ArticleIDDimArticle.ArticleID
- ChannelKeyDimChannel.ChannelKey
- Price
Stop 06 / 06 · Selected work
Work in progress · Retail analytics
The H&M dashboard covers sales, products, customers and channels across 31.8 million purchased items.
The interactive report is still in development. The saved chart breaks sales changes into buyer numbers, items per buyer, and prices and product mix.
Through 22 September 2020, sales on matched dates fell 10.9% despite 1.6% more buyers. Fewer items per buyer outweighed the gains elsewhere.

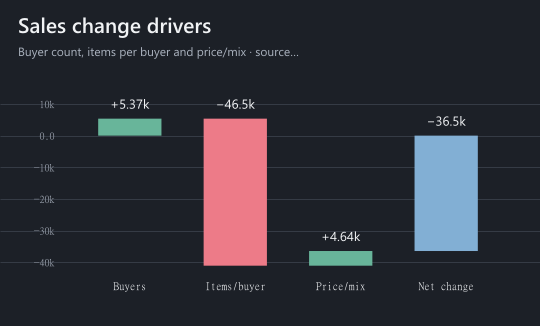
This chart comes from the H&M report in development. It compares sales from 1 January to 22 September 2020 with the same dates in 2019, excluding leap day.
Sales fell 10.9% even as the number of buyers grew 1.6%. The largest downward bar shows that fewer items per buyer outweighed the gain from additional buyers. Changes in prices and the mix of products sold offset part of the fall.
Explore the data model ↓Aggregate analysis of the H&M fashion recommendations data. Competition data terms.
One row represents one purchased article. Article, customer, date and channel describe the purchase; price sits on the fact table.