Stop 03 / 06  ·  Selected work

Rossmann store sales.

Store Sales Dashboard · Retail analytics

The Rossmann dashboard breaks sales into visits and spend per visit across 1,115 stores and over a million daily trading records.

Four pages cover sales, store performance, trends and promotions. Each store’s trading dates are matched to the same dates a year earlier.

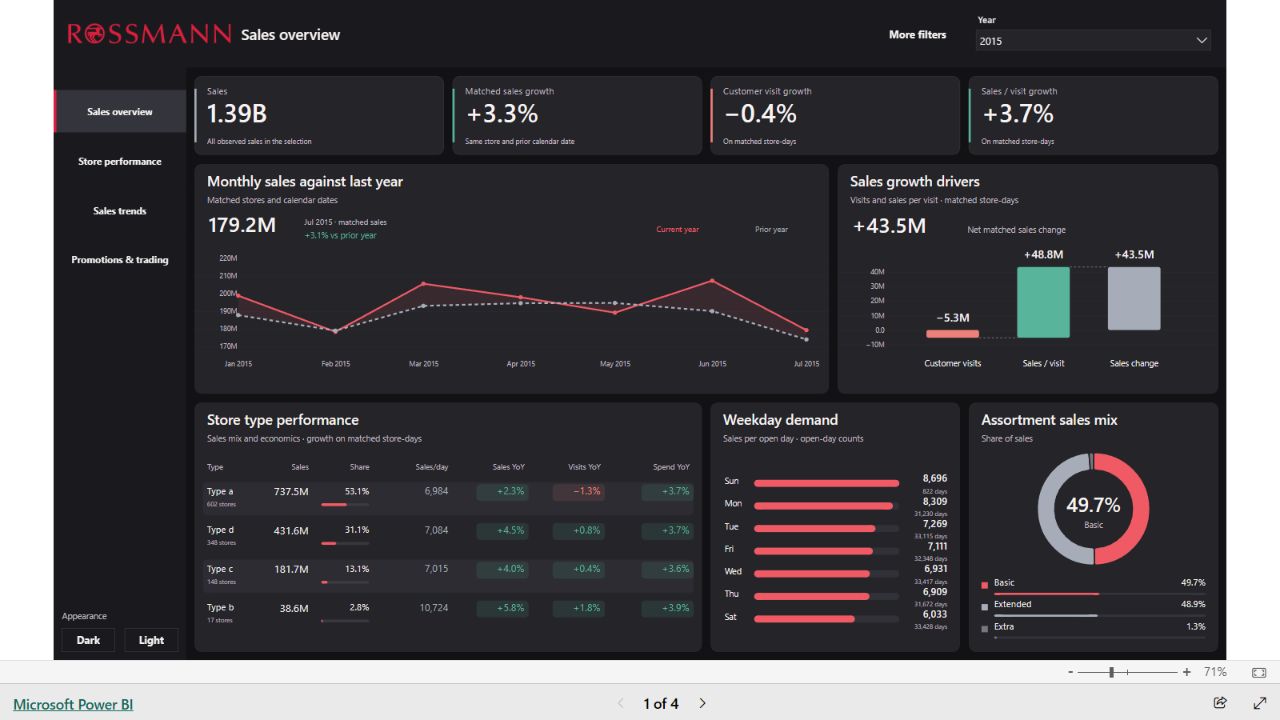
In January–July 2015, matched sales grew 3.3% even though visits fell 0.4%. Sales per visit rose 3.7%, enough to offset the fall in visits.

The market street at dusk, with a stepped path.
03 / Market street
INTERACTIVE REPORT

Rossmann Store Sales Dashboard

TECH STACK
  • Power BI
  • DAX
  • Power Query
Open report
Saved overview of Rossmann Store Sales Dashboard

Sales overview breaks revenue growth down by customer visits and spend per visit. For each store, the year-on-year comparison includes trading dates with a match one year earlier.

From January to July 2015, matched sales grew 3.3%. Visits fell 0.4%, but spend per visit rose 3.7%. The sales growth drivers chart shows how those two changes add up.

Open Store performance to see which stores followed that pattern. Promotions & trading lets you compare promotional and ordinary trading days within your selection.

Explore the data model ↓
Data source & licence

Sales and store data from the Rossmann Store Sales competition. Competition data terms.

Data model

One row records one store on one trading date. Store, date, holiday, promotion and opening status put its sales and customer visits in context.

Relationships
100%
DimensionDimDate12 columns

Columns

  • Date
  • DateKeyFactDailySales.DateKey
  • Year
  • MonthNumber
  • Month
  • YearMonthKey
  • YearMonth
  • MonthStart
  • Quarter
  • WeekdayNumber
  • Weekday
  • IsWeekend
DimensionDimStore15 columns

Columns

  • StoreKeyFactDailySales.StoreKey
  • Store
  • StoreType
  • Assortment
  • AssortmentLabel
  • CompetitionDistance
  • CompetitionOpenSinceMonth
  • CompetitionOpenSinceYear
  • Promo2
  • Promo2SinceWeek
  • Promo2SinceYear
  • PromoInterval
  • Promo2Participation
  • CompetitionDistanceBand
  • CompetitionDistanceSort
Measure hostRossmann Measures1 column · 63 measures

Columns

  • Anchor

Measures

Appearance
  • AppearanceMode
  • Button Dark Fill
  • Button Light Fill
  • Chart Appearance
  • Theme Accent
  • Theme Bad
  • Theme Canvas
  • Theme Card
  • Theme Good
  • Theme Grid
  • Theme Highlight
  • Theme Muted
  • Theme Neutral
  • Theme Rail
  • Theme Text
  • Theme Warning
Comparisons
  • Matched Coverage
  • Matched Prior Year Sales
  • Matched Prior Year Visits
  • Matched Sales
  • Matched Sales YoY
  • Matched Store Days
  • Matched Visits
  • Matched Visits YoY
Coverage
  • Calendar Presence
  • Data Through
  • Latest Observed Date
Decision support
  • Matched Prior Sales per Visit
  • Matched Sales Change
  • Matched Sales per Visit
  • Matched Spend YoY
  • Median Store Promotion Gap
  • Nonpromotion Open Days
  • Nonpromotion Visits per Open Day
  • Observed Promotion Visits Gap
  • Promotion Open Days
  • Promotion Sales Mix
  • Promotion Visits per Open Day
  • Qualified Promotion Gap
  • Qualifying Promotion Stores
  • Spend Change Contribution
  • Store Investigation Priority
  • Traffic Change Contribution
Presentation
  • Coverage Detail
  • Sales Card Detail
  • Selected Period
  • Visits Card Detail
Promotions
  • Nonpromotion Sales per Open Day
  • Observed Promotion Gap
  • Promotion Sales per Open Day
  • Promotion Share of Sales
Sales
  • Customer Visits
  • Sales per Customer Visit
  • Total Sales
Trading
  • Closed Store Days
  • Observed Store Days
  • Open Customer Visits
  • Open Rate
  • Open Sales
  • Open Store Days
  • Sales per Open Store Day
  • Stores with Observations
  • Visits per Open Store Day
Drag to pan · Ctrl + wheel to zoom · Expand a table to see its fields · Drag its grip to move it One Many Key Foreign key