INTERACTIVE REPORT

Rossmann Store Sales Dashboard

TECH STACK
  • Power BI
  • DAX
  • Power Query
Open report
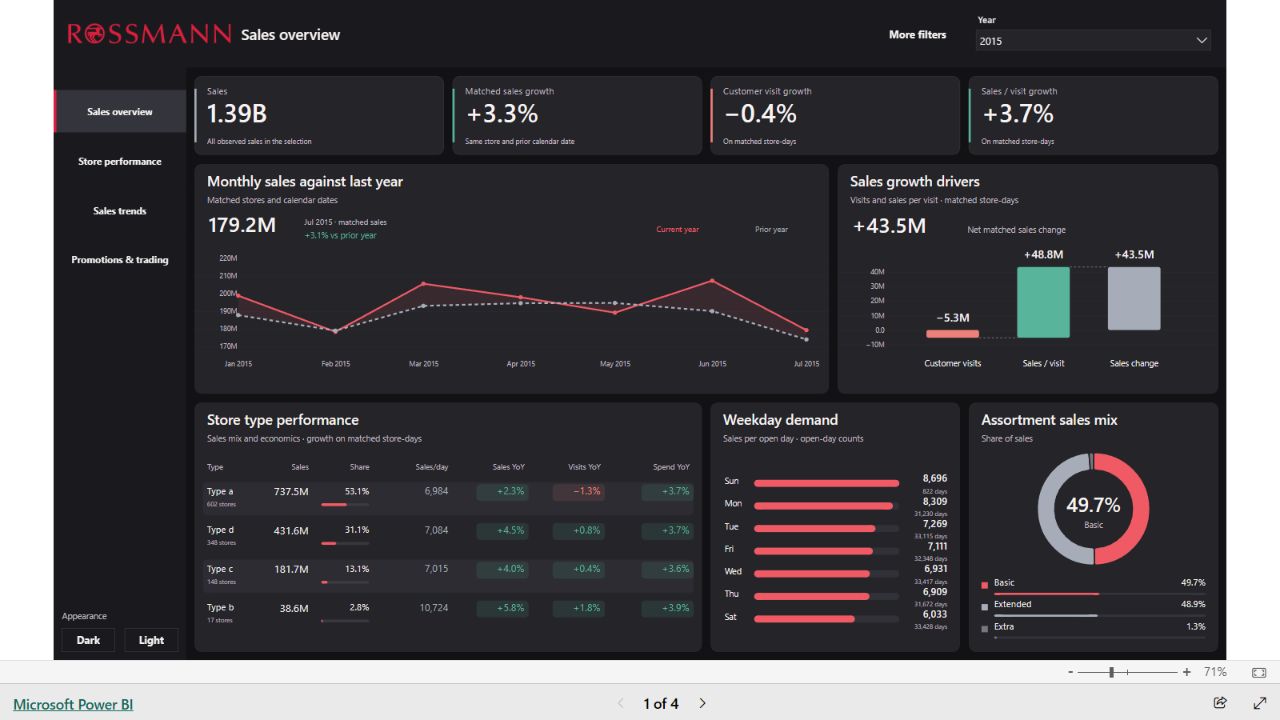
Saved overview of Rossmann Store Sales Dashboard

Across 1,115 stores and more than a million daily records, this dashboard separates changes in customer visits from changes in spend per visit. It compares the same store on dates with a match one year earlier.

From January to July 2015, matched sales grew 3.3%. Visits fell 0.4%, but spend per visit rose 3.7%. The sales growth drivers chart shows how those two changes add up.

Open Store performance to see which stores followed that pattern. Promotions & trading lets you compare promotional and ordinary trading days within your selection.
Explore the data model ↓
Data source & licence

Sales and store data from the Rossmann Store Sales competition. Competition data terms.

Next project · Heathrow →

Data model

One row records one store on one trading date. Store, date, holiday, promotion and opening status put its sales and customer visits in context.

Relationships
100%
DimensionDimDate12 columns

Columns

  • Date
  • DateKeyFactDailySales.DateKey
  • Year
  • MonthNumber
  • Month
  • YearMonthKey
  • YearMonth
  • MonthStart
  • Quarter
  • WeekdayNumber
  • Weekday
  • IsWeekend
DimensionDimStore15 columns

Columns

  • StoreKeyFactDailySales.StoreKey
  • Store
  • StoreType
  • Assortment
  • AssortmentLabel
  • CompetitionDistance
  • CompetitionOpenSinceMonth
  • CompetitionOpenSinceYear
  • Promo2
  • Promo2SinceWeek
  • Promo2SinceYear
  • PromoInterval
  • Promo2Participation
  • CompetitionDistanceBand
  • CompetitionDistanceSort
Measure hostRossmann Measures1 column · 63 measures

Columns

  • Anchor

Measures

Appearance
  • AppearanceMode
  • Button Dark Fill
  • Button Light Fill
  • Chart Appearance
  • Theme Accent
  • Theme Bad
  • Theme Canvas
  • Theme Card
  • Theme Good
  • Theme Grid
  • Theme Highlight
  • Theme Muted
  • Theme Neutral
  • Theme Rail
  • Theme Text
  • Theme Warning
Comparisons
  • Matched Coverage
  • Matched Prior Year Sales
  • Matched Prior Year Visits
  • Matched Sales
  • Matched Sales YoY
  • Matched Store Days
  • Matched Visits
  • Matched Visits YoY
Coverage
  • Calendar Presence
  • Data Through
  • Latest Observed Date
Decision support
  • Matched Prior Sales per Visit
  • Matched Sales Change
  • Matched Sales per Visit
  • Matched Spend YoY
  • Median Store Promotion Gap
  • Nonpromotion Open Days
  • Nonpromotion Visits per Open Day
  • Observed Promotion Visits Gap
  • Promotion Open Days
  • Promotion Sales Mix
  • Promotion Visits per Open Day
  • Qualified Promotion Gap
  • Qualifying Promotion Stores
  • Spend Change Contribution
  • Store Investigation Priority
  • Traffic Change Contribution
Presentation
  • Coverage Detail
  • Sales Card Detail
  • Selected Period
  • Visits Card Detail
Promotions
  • Nonpromotion Sales per Open Day
  • Observed Promotion Gap
  • Promotion Sales per Open Day
  • Promotion Share of Sales
Sales
  • Customer Visits
  • Sales per Customer Visit
  • Total Sales
Trading
  • Closed Store Days
  • Observed Store Days
  • Open Customer Visits
  • Open Rate
  • Open Sales
  • Open Store Days
  • Sales per Open Store Day
  • Stores with Observations
  • Visits per Open Store Day
Drag to pan · Ctrl + wheel to zoom · Expand a table to see its fields · Drag its grip to move it One Many Key Foreign key