INTERACTIVE REPORT

Spotify Audio Intelligence

TECH STACK
  • Power BI
  • Deneb
Open report
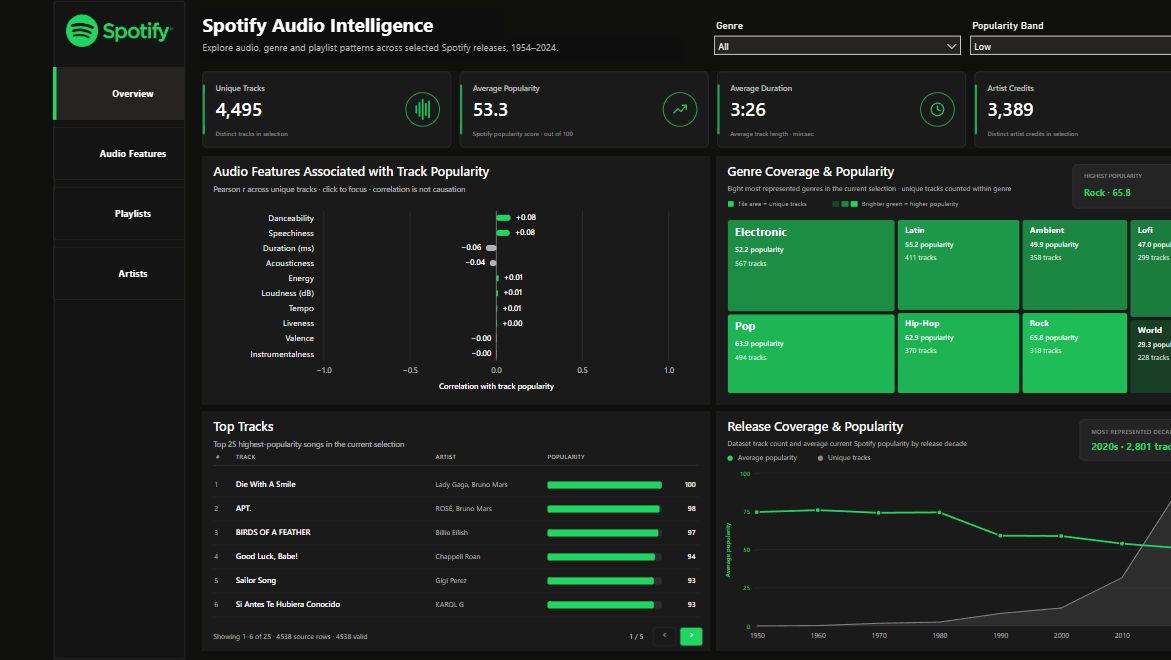
Saved overview of Spotify Audio Intelligence

Explore how energy, acousticness, loudness and tempo vary across 4,495 distinct tracks in a selection of Spotify playlists. The releases in this dataset span 1954 to 2024.

Across the playlist records, tracks with higher energy scores tend to be louder and less acoustic. Tempo and danceability show little association in this sample.

Try filtering to a genre on Audio Features to see whether the pattern holds. Use Playlists and Artists to see which tracks and performers contribute to your selection.
Explore the data model ↓
Data source & licence

Adapted from Solomon Ameh’s Spotify Music Dataset. The database is available under the Open Database Licence and its contents under the Database Contents Licence.

Next project · H&M →

Data model

Track appearances on playlists and individual audio-feature values sit in separate fact tables. The track dimension connects the two.

Relationships
100%
FactFactTrackFeatureAnalysis6 columns

Columns

  • idDimTrack.id
  • track_popularity
  • Audio Feature
  • Feature Value
  • playlist_genre
  • popularity_band
Measure hostMeasures11 column · 21 measures

Columns

  • Column

Measures

  • Artist Credits
  • Average Duration Seconds
  • Average Popularity
  • Feature Correlation
  • Measure
  • Track Popularity
  • Tracks Analysed
Audio Profile
  • Average Acousticness
  • Average Danceability
  • Average Duration Minutes
  • Average Energy
  • Average Loudness LUFS
  • Average Tempo BPM
  • Average Valence
Overview
  • Playlist Placements
  • Unique Albums
  • Unique Playlists
  • Unique Tracks
Popularity
  • Average Track Popularity
  • High-Popularity Share
  • High-Popularity Tracks
Drag to pan · Ctrl + wheel to zoom · Expand a table to see its fields · Drag its grip to move it One Many Key Foreign key