WORK IN PROGRESS

H&M Retail Insights

TECH STACK
  • Power BI
  • DAX
  • Power Query
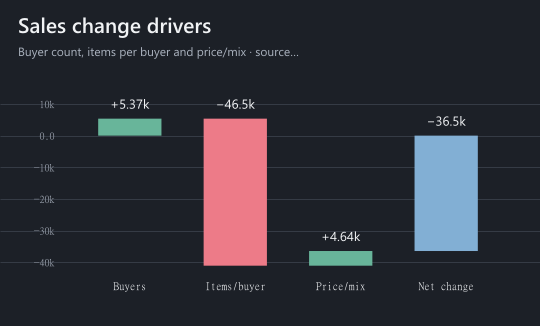
Sales change bridge: more buyers and price/product mix contribute positively, but fewer items per buyer drive the net decline.
Saved chart · January–22 September 2020 · paired dates

This saved chart from the H&M retail report breaks sales changes into buyer numbers, items per buyer, price and product mix. It compares 1 January to 22 September 2020 with the same dates in 2019, excluding leap day.

Sales fell 10.9% even as the number of buyers grew 1.6%. The largest downward bar shows that fewer items per buyer outweighed the gain from additional buyers. Changes in prices and the mix of products sold offset part of the fall.

Explore the data model ↓
Data source & licence

Aggregate analysis of the H&M fashion recommendations data. Competition data terms.

Back to introduction →

Data model

One row represents one purchased article. Article, customer, date and channel describe the purchase; price sits on the fact table.

Relationships
100%
DimensionDimArticle11 columns

Columns

  • ArticleIDFactPurchases.ArticleID
  • ProductCode
  • Product
  • ProductType
  • ProductGroup
  • Colour
  • Department
  • Index
  • Segment
  • Section
  • GarmentGroup
DimensionDimDate8 columns

Columns

Measure hostHM Measures1 column · 58 measures

Columns

  • _

Measures

  • Channel 1 Sales
  • Channel 2 Sales
Appearance
  • AppearanceMode
  • Chart Appearance
  • Theme Accent
  • Theme Bad
  • Theme Canvas
  • Theme Card
  • Theme Good
  • Theme Grid
  • Theme Highlight
  • Theme Muted
  • Theme Neutral
  • Theme Rail
  • Theme Text
  • Theme Warning
Metrics
  • Average Item Price
  • Buyer Contribution
  • Buying Customers
  • Buying Customers YoY
  • Calendar Presence
  • Channel 2 Share
  • Comparison Coverage
  • Decline Priority
  • Intensity Contribution
  • Item Price YoY
  • Matched Buying Customers
  • Matched Item Price
  • Matched Sales
  • Matched Units
  • Matched Units per Buyer
  • Observed Days
  • Period End
  • Period Start
  • Previously Observed Buyers
  • Previously Observed Share
  • Price Contribution
  • Prior Buying Customers
  • Prior Item Price
  • Prior Sales
  • Prior Units
  • Prior Units per Buyer
  • Sales
  • Sales Change
  • Sales per Buyer
  • Sales per Observed Day
  • Sales Share
  • Sales YoY
  • Sold Articles
  • Source End
  • Source Sales
  • Source Start
  • Source Units
  • Units
  • Units per Article
  • Units per Buyer
  • Units per Buyer YoY
  • Units YoY
Drag to pan · Ctrl + wheel to zoom · Expand a table to see its fields · Drag its grip to move it One Many Key Foreign key