INTERACTIVE REPORT

London School of Economics B3 Threshold Dashboard

TECH STACK
  • Power BI
  • DAX
  • Power Query
  • Alteryx
Open report
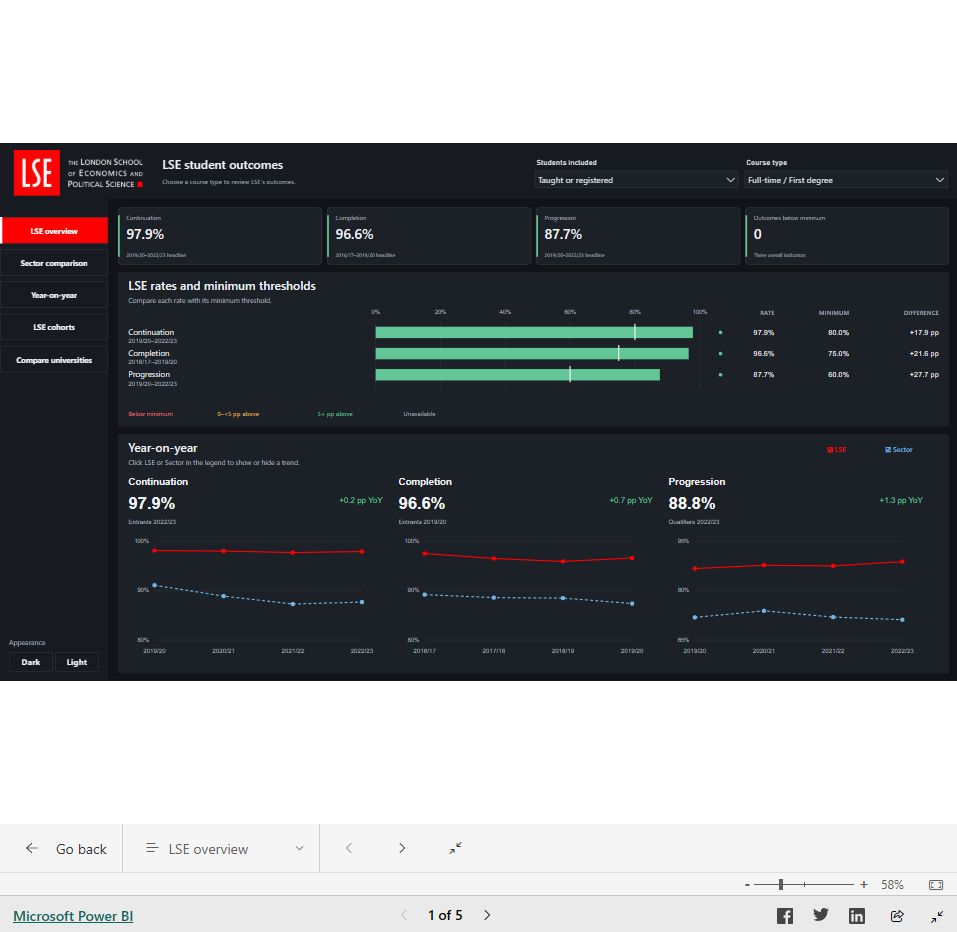
Saved overview of London School of Economics B3 Threshold Dashboard

Compare continuation, completion and progression at LSE with Office for Students B3 thresholds and sector results. Choose a study mode and course level to see the figures for that cohort.

For taught or registered, full-time first-degree students, continuation was 97.9%, completion was 96.6% and progression was 87.7%. The corresponding minimums shown on the overview are 80%, 75% and 60%.

Try adjusting a threshold to see how much headroom a cohort has. The confidence intervals show the uncertainty around each estimate. This independent portfolio analysis uses the thresholds as reference points.
Explore the data model ↓
Data source & licence

Student outcomes data from the Office for Students. Contains public sector information licensed under the Open Government Licence v3.0 where owned by OfS. Third-party rights are listed in the OfS copyright notice.

Next project · Rossmann →

Data model

One published outcome observation links to its provider, student population, outcome, study group, reporting period, split and source release.

Relationships
100%
FactFactOutcomeObservation54 columns

Columns

  • ObservationKey
  • ProviderKeyDimProvider.ProviderKey
  • PopulationViewKeyDimPopulationView.PopulationViewKey
  • OutcomeMeasureKeyDimOutcomeMeasure.OutcomeMeasureKey
  • StudyKeyDimStudy.StudyKey
  • ReportingPeriodKeyDimReportingPeriod.ReportingPeriodKey
  • ReportingSplitKeyDimReportingSplit.ReportingSplitKey
  • SourceReleaseKeyDimSourceRelease.SourceReleaseKey
  • OutcomePct
  • ThresholdPct
  • Denominator
  • BenchmarkPct
  • PublishedDifferencePpt
  • ResponseRatePct
  • BelowThresholdUncertaintyPct
  • AboveThresholdUncertaintyPct
  • BelowBenchmarkUncertaintyPct
  • AboveBenchmarkUncertaintyPct
  • StandardDeviation
  • ContributionToBenchmarkPct
  • OutcomeLower75Pct
  • OutcomeUpper75Pct
  • OutcomeLower77Pct
  • OutcomeUpper77Pct
  • OutcomeLower80Pct
  • OutcomeUpper80Pct
  • OutcomeLower82Pct
  • OutcomeUpper82Pct
  • OutcomeLower85Pct
  • OutcomeUpper85Pct
  • OutcomeLower87Pct
  • OutcomeUpper87Pct
  • OutcomeLower90Pct
  • OutcomeUpper90Pct
  • OutcomeLower92Pct
  • OutcomeUpper92Pct
  • OutcomeLower95Pct
  • OutcomeUpper95Pct
  • OutcomeLower97Pct
  • OutcomeUpper97Pct
  • OutcomeLower99Pct
  • OutcomeUpper99Pct
  • OutcomePctRaw
  • DenominatorRaw
  • BenchmarkPctRaw
  • PublishedDifferencePptRaw
  • SuppressionReason
  • BenchmarkSuppressionReason
  • IsHeadline
  • HasComparableOutcome
  • BelowOfficialThresholdFlag
  • ScopeYear
  • ScopeRange
  • IsCurrentHeadline
DimensionDimProvider18 columns

Columns

  • ProviderKeyFactOutcomeObservation.ProviderKey
  • ProviderUKPRN
  • ProviderName
  • ProviderShortName
  • ProviderRegion
  • CountryCode
  • ProviderCategory
  • FEProvider
  • ProviderType
  • Specialist
  • RussellGroup
  • UniversityAlliance
  • MillionPlus
  • GuildHE
  • Pre92
  • Post92
  • IsSectorAggregate
  • MetadataSource
Measure hostB3 Measures1 column · 143 measures

Columns

  • Anchor

Measures

Annual trends
  • Annual Outcome Pct
  • Annual Sector Pct
  • Annual YoY Pp
  • Previous Annual Outcome Pct
Appearance
  • Annual Appearance
  • AppearanceMode
  • Button Dark Fill
  • Button Light Fill
  • Chart Appearance
  • Comparison Annual Appearance
  • LSE Headline Appearance
  • Peer Headline Appearance
  • Provider Headline Appearance
  • Sector Headline Appearance
  • Theme Accent
  • Theme Bad
  • Theme BadBg
  • Theme Blue
  • Theme Canvas
  • Theme Card
  • Theme Good
  • Theme GoodBg
  • Theme Grid
  • Theme Highlight
  • Theme Muted
  • Theme Positive
  • Theme Rail
  • Theme Text
  • Theme Warn
  • Theme WarnBg
Comparable observation counts
  • % Above Threshold
  • % Below Threshold
  • Total Indicators
Compatibility
  • Tooltip Row Colour
  • Tooltip Value
Confidence intervals
  • CI Range %
  • CI Width Pp
  • Risk Status
  • Selected Confidence Level
  • Selected Lower CI
  • Selected Lower CI %
  • Selected Upper CI
  • Selected Upper CI %
LSE views
  • Comparison Annual Peer Name
  • Comparison Peer Name
  • Comparison University Name
  • Completion Headline Gap Pp
  • Completion Headline Pct
  • Completion Headline Period
  • Confidence Label
  • Continuation Headline Gap Pp
  • Continuation Headline Pct
  • Continuation Headline Period
  • LSE Below Minimum Outcomes
  • Observation Period
  • Overall Headline Pct
  • Progression Headline Gap Pp
  • Progression Headline Pct
  • Progression Headline Period
  • Selected Cohort View
  • Show Uncertainty
Published observations
  • Cell Colour
  • Completion Value
  • Continuation Value
  • Current Threshold
  • Distance to Band
  • Distance to Threshold
  • Headline Value %
  • INDICATOR_VALUE %
  • Outcome Rate Pct
  • Progression Value
  • Published Benchmark Difference Pp
  • Published Benchmark Pct
  • Published Denominator
Quality checks
  • Context Status
  • Count Reconciliation Difference
  • Observation Count
  • Observation Note
  • Providers With Data
  • Single Observation
Scenario only
  • Scenario Threshold Pct
  • Threshold Adjustment Value
Scoped annual values
  • LSE Annual Denominator
  • LSE Annual Rate Pct
  • LSE Annual Rows
  • LSE Annual Threshold Pct
  • LSE Annual YoY Pp
  • LSE Previous Annual Pct
  • Peer Annual Denominator
  • Peer Annual Rate Pct
  • Peer Annual Rows
  • Peer Annual Threshold Pct
  • Peer Annual YoY Pp
  • Peer Previous Annual Pct
  • Provider Annual Denominator
  • Provider Annual Rate Pct
  • Provider Annual Rows
  • Provider Annual Threshold Pct
  • Provider Annual YoY Pp
  • Provider Previous Annual Pct
  • Sector Annual Denominator
  • Sector Annual Rate Pct
  • Sector Annual Rows
  • Sector Annual Threshold Pct
  • Sector Annual YoY Pp
  • Sector Previous Annual Pct
Scoped headline values
  • LSE Headline Denominator
  • LSE Headline Lower CI
  • LSE Headline Period
  • LSE Headline Rate Pct
  • LSE Headline Rows
  • LSE Headline Threshold Pct
  • LSE Headline Upper CI
  • LSE Overall Denominator
  • LSE Overall Period
  • LSE Overall Rate Pct
  • LSE Overall Threshold Pct
  • Peer Headline Denominator
  • Peer Headline Lower CI
  • Peer Headline Period
  • Peer Headline Rate Pct
  • Peer Headline Rows
  • Peer Headline Threshold Pct
  • Peer Headline Upper CI
  • Provider Headline Denominator
  • Provider Headline Lower CI
  • Provider Headline Period
  • Provider Headline Rate Pct
  • Provider Headline Rows
  • Provider Headline Threshold Pct
  • Provider Headline Upper CI
  • Sector Headline Denominator
  • Sector Headline Lower CI
  • Sector Headline Period
  • Sector Headline Rate Pct
  • Sector Headline Rows
  • Sector Headline Threshold Pct
  • Sector Headline Upper CI
Scoped sector counts
  • At or Above Threshold Count
  • Below Threshold Count
  • Comparable Providers
  • Missing Outcome Count
Source values
  • Published Single Rate Pct
Drag to pan · Ctrl + wheel to zoom · Expand a table to see its fields · Drag its grip to move it One Many Key Foreign key